EASY COMEXT
2.5.0
http://epp.eurostat.ec.europa.eu/newxtweb/
What
will you learn from this Guide?
What’s
new in Easy Comext 2.5.0?
User profile under Easy Comext
Available functions depending on
profile (Non Register users/Register users)
Step 1: Extraction query definition:
method 1
Specific codes selection panel:
Enable multiple query selection for
deletion
Step 1: Extraction query definition:
method 2
Step 2: Extraction Layout definition
Step
3: Extraction Option /Submission
Display the result of an extraction:
Add the formula to the spreadsheet
Make a new selection in the Header
dimensions (Product, Indicators,..)
View dataset or Dimension metadata
Generate Static graphics and Map
Generation of interactive Charts
Generation of Treemap dynamic chart
Perform computations on the
extraction
PREFACE
The User Guide
Welcome to EASY COMEXT
EASY COMEXT is an HTML based interface giving to the public at
Eurostat’s External Trade database.
The access to Easy Comext interface is done through the Eurostat’s
internet site:
In preparing this guide, we have made every effort to avoid technical terminology and computing jargon. This guide, therefore, explains how to work with EASY COMEXT using easy, non-technical language.
It shows the different steps to follow in order to prepare requests for Foreign Trade data in various formats.
This guide is divided up into eight sections.
The latest version of Easy Comext has been improved with a consequent list of new functions, such as:
- Geographical maps were extended
- Formulas can be added from the spreadsheet
- Grow rate post-computation was added in the spreadsheet
- ECAS integration
To use the system fully, you must have adobe Flash installed for the Dynamic Charts functionality.
Requirements
Data stored in the EASY COMEXT database resides at a central site that can be remotely accessed by your PC via Eurostat machines.
Connection
Starting with EASY COMEXT
http://epp.eurostat.ec.europa.eu/portal/page/portal/eurostat/home/


Fig. 01: Eurostat’s site home page
Click on the link ‘Complete Database’
to reach the following page:
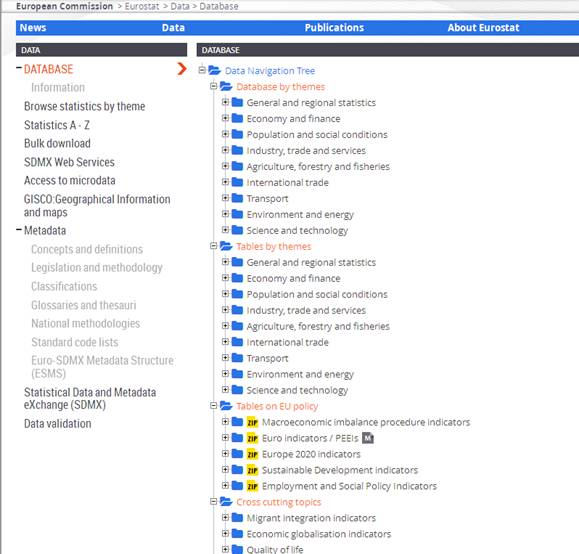
Fig.02:
Eurostat Database Tree
To start Easy Comext, select the « Database » / External Trade
/ « External Trade Detailed data (detail)» to open the following
content :
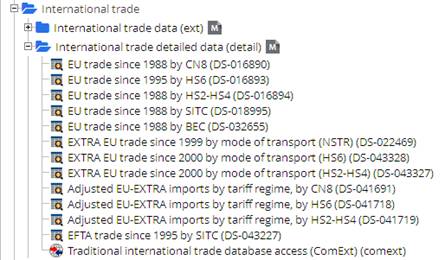
Fig.03:
International Trade content
General
information:
Eurostat data is available free of
charge and can be explored via the tree below.
If you wish to use enhanced
functionalities (EVA Java, HTML, file in csv format, increased number of cells
from 10000 to 300000) in order to download the data of interest to you or if
you want to save your query for further use, please register.
Registered users and Commission
users can access by using their usual login and password.
Legend:
The dataset Selection enable users
to select the requested level of data (Aggregated or Detailed).
To start Easy COMEXT, click on the
following icon:
Note: When the window of Easy
COMEXT is open, the user can add the address into “favourites” addresses. This
address permitting a direct access to “Easy COMEXT” corresponds to
http://epp.eurostat.ec.europa.eu/newxtweb/
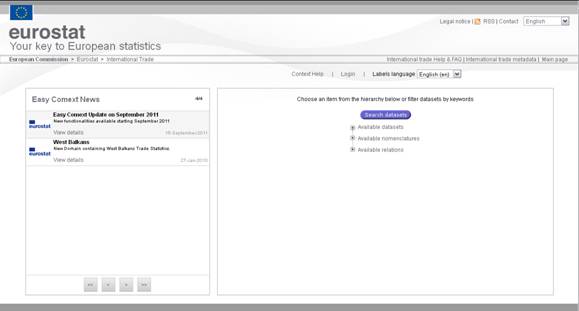
EASY COMEXT home page:
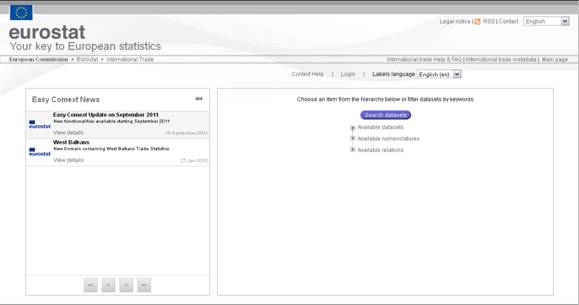
Fig.04: EASY COMEXT Home Page

Fig.05: Default (not registered users) toolbar
Language selection:  Enable users to change the language
Open the main page for External
trade metadata with the following links:
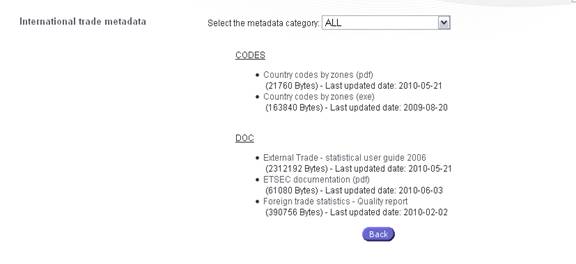
Fig.06:
International Metadata home page
-
Codes
o Country codes
-
Doc
o
ETSEC documentation
(pdf)
o
Foreign Trade statistics – Quality report : Quality report on external trade statistics (pdf)
o
User Guide: Statistics on the trading of goods - user guide (pdf)
-
METHODOLOGY NOTES
International trade Help & FAQ: ![]()
The International trade Help and FAQ will
enable access to open the user guide (PDF-format)
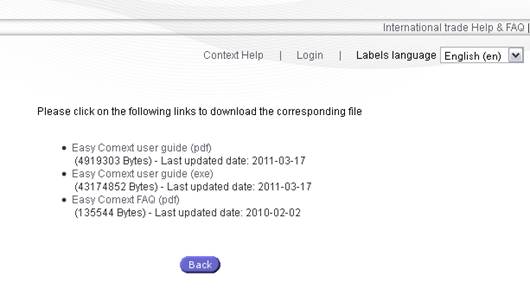
Fig.07: Help
& FAQ page
Login: Press ![]() to access the system as a registered user.
to access the system as a registered user.
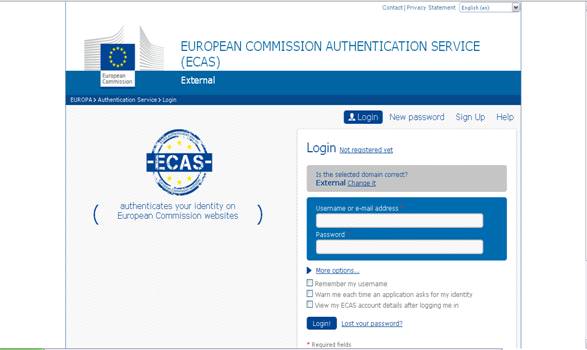
Fig.08:
Login window
Main Page: ![]() will open the home page
of Easy COMEXT.
will open the home page
of Easy COMEXT.
Analytical Client: ![]() Available
for registered users only, this will switch to Comext Analytical client.
Analytical client facilities will become available from extractions and
extraction’s queries, previously built (extracted) with Easy Comext.
Available
for registered users only, this will switch to Comext Analytical client.
Analytical client facilities will become available from extractions and
extraction’s queries, previously built (extracted) with Easy Comext.
The Analytical client
option will only be available from the following page of Easy Comext:
- The main page
- The Saved Query page
- The Extraction page
- The Completed Works page

Fig. 09: Analytical
Client access
Note: No re-login will be required for the Analytical
Comext Client Interface. Current open session’s extractions, saved queries and
completed works will be available for the users switching to the Analytical
Comext interface.
User profile under
Easy Comext
It is possible to extract data with
Easy COMEXT without being registered. Most of the functions are available but
the size of the authorised extraction is smaller than for the registered users.
In addition, registered users will have access to the full set of functions.
The registration procedure is easy and free.
Available functions depending on profile (Non Register users/Register
users)
Non registered users or registered and not logged in
Dataset selection
Ø Select the appropriate
dataset from a hierarchy
Ø Search for a dataset
Query definition
Ø Define an extraction
(new query)
Ø Open a default query
Ø Choose from a list of prepared
queries
Ø Define aggregates based
on groups of elements
Ø Define formulas based on
elements (stored in browser session)
Ø Browse through a
hierarchy of codes
Ø Search for codes
Layout selection
Ø
Choose the dimensions on each axis of the layout
Ø
Choose the format of each axis
Extraction operations
Ø
Extract interactively data according to an extraction definition
Ø
Visualise and download extracted data
Ø
Perform post computations on extracted data
Ø
Show footnotes attached on extracted data
Metadata
Ø View new information
Ø Visualise and download
Metadata (Methodology, classifications etc.)
Ø
Access to contextual help
Registered users
(logged in)
The system allows users carrying
out all operations of a not logged in user, plus:
User
operations
Ø Create query in Text
Query Editor
Ø Save and retrieve a
query
Ø Save and retrieved
formulas at the extraction plans
Ø Display a list of
terminated work during the last 48 hours
Ø Display and download
extraction results
Ø Be informed by e-mail
when an extraction has finished
Ø Be able to switch to the
Analytical Comext Client interface for more advance functions.
Ø See notifications
generated by Metadata Editor
Extraction
operations
Ø Extract more data than a
not registered user
Ø Extract in batch mode.
In this case, the job is submitted to the system for later execution (when system resources are available).
Extraction results are stored at the
server for 48 hours and the user can display or download them during this period.
Ø Get information on the
status of a batch extraction (waiting, running, finished)
Ø Enable the auto extract
mode when the related dataset is updated
Note: Registration has to be
done only once (ECAS). To register, a user must select "login” and then
click on the Register link.
On the home page, the toolbar displays
the following options:
![]()
Fig. 10: Main Toolbar
|
Notifications |
Display Notifications list |
|
Context Help |
EASY Comext Help |
|
Logout |
To close current session |
|
Existing Query |
View and Manage saved queries |
|
Batch jobs |
View the status of the batch jobs |
|
Completed Works |
View and carry operations with extractions |
|
Tools |
Download (standalone COMEXT) |
|
Profile |
Modify registration information |
|
Password |
Modify password |
The centre of the home page
displays the list of the available datasets. To start the extraction process,
users will have to select a dataset.
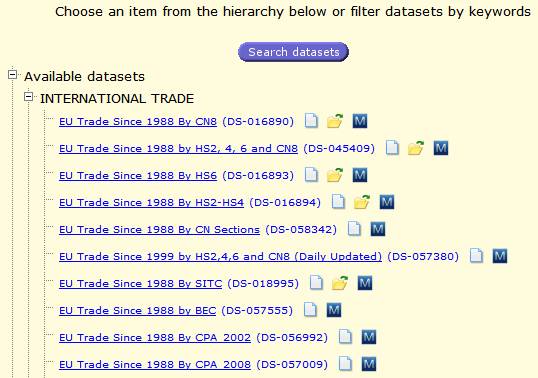
Fig. 11: Available Datasets
On the left of the list of the
datasets, all Easy COMEXT news is also displayed:
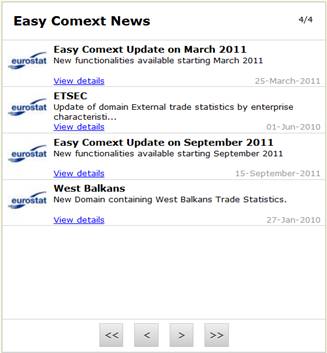
Fig. 12: Easy Comext News
The news will provide information on topics
mentioned under the “Headline” column. In order to get the full information,
users will click on the “View details” link.
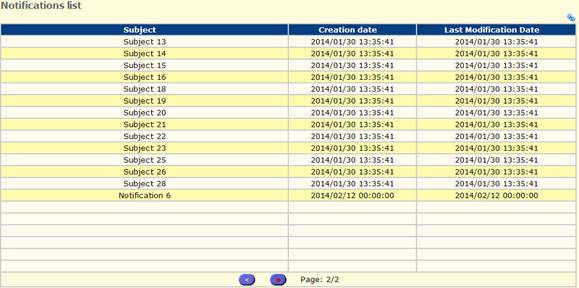
Fig. 13: Notifications list
Press icon ![]() in the top right corner to filter existing
notifications by creation date, last modification date, subject, and
status (‘unseen’ only or all).
in the top right corner to filter existing
notifications by creation date, last modification date, subject, and
status (‘unseen’ only or all).
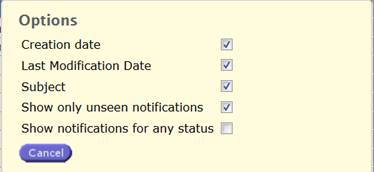
The
user can check on uncheck the option boxes according to the filter he wants to
implement.
In
order to display the notification’s content, the user must double click on the
notification.
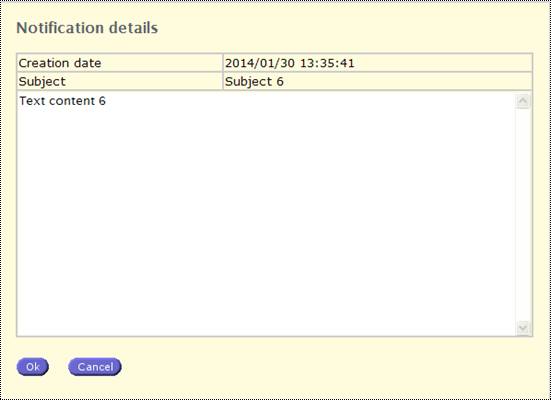
Fig. 14: Notification details
An
opened notification is marked as ‘seen’ when user presses ![]() to close it.
to close it.
Note: Users cannot generate
notifications. They can only receive them. Notifications are created by the
Metadata Editor administrators. Whenever user has ‘unseen’ notifications the
Notifications link on the main page has red colour.
MAKE AN EXTRACTION
Introduction
When the user left clicks
on the name of a dataset, Easy COMEXT will display a floating menu with a
number of available options depending on the user type.
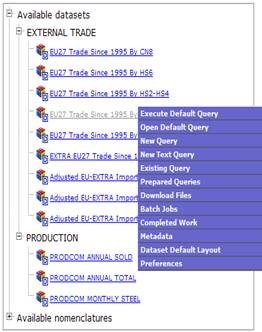
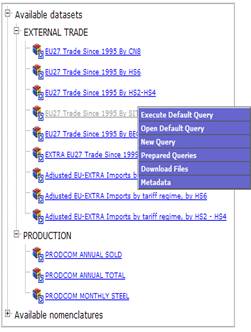
Fig. 15: Registered user menu
Fig. 16: Non Registered user menu
The
floating menu contains the links to the several options of Easy COMEXT. The
“Query” options will enable users to define query or to use existing query.
|
|
Extract the default query and to display
results in a predefined structure. |
|
|
Open the default query and display the
content of the dimensions. |
|
|
Open the query definition windows Open Text query editor to define the new
text query. Registered user only |
|
|
To open a previously defined extraction
Query (Query defined by the user). Registered user only |
|
|
To open predefined extraction Query
(predefined by Eurostat). These Queries contain extraction by “Type” of
Products, i.e. TEXTILE, etc.). |
|
|
To download files containing information
links to the selected dataset. |
|
|
Display the status of extraction launch
in Batch mode. Registered user only |
|
|
Display the window containing the list of
the extractions (and output files) produced in Batch mode extractions. Registered
user only |
|
|
Open the metadata associated to the
dataset. |
|
|
Enable to define a default layout for
the selected dataset. |
Selecting
one of the “Query” options (Default Query, New Query, Existing Query or
Prepared Queries), will bring the user to the
first step of the extraction procedure.
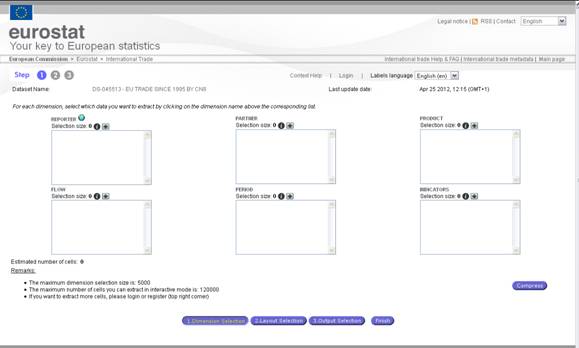
Fig. 17: Step 1 (Default query)
 Step 1: Extraction
query definition: method 1
Step 1: Extraction
query definition: method 1
The
windows enabling the query definition is composed of dimension boxes. The
number and the name of the dimensions are linked to the dataset selected during
the previous phase.
Fig. 18: Query definition window
In
the example, the dataset “EU27 TRADE
SINCE 1995 BY CN8” is composed of the following dimensions:
REPORTER
PARTNER
PRODUCT
FLOW
PERIOD
INDICATORS
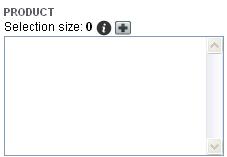
During
the query definition, you can select, for each dimension a code or a list of
code for the extraction.
![]() To define the content of
a specific dimension, you will have to click
on the name of the dimension. This action will open the Dimension selection
window. To add all available elements you can press the plus sign. It is not
necessary to open the dimension in this case.
To define the content of
a specific dimension, you will have to click
on the name of the dimension. This action will open the Dimension selection
window. To add all available elements you can press the plus sign. It is not
necessary to open the dimension in this case.
Click
on the Dimension names to select codes, groups or aggregates
Dimension selection window:
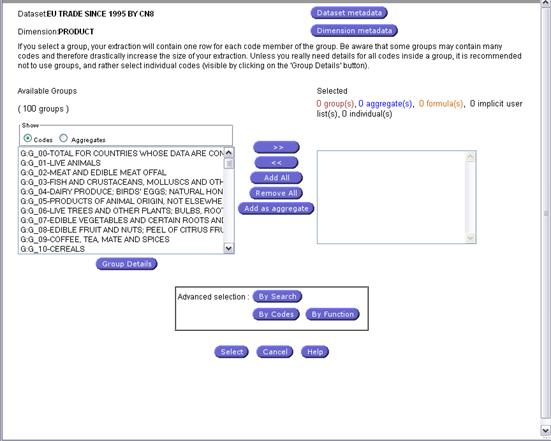
Fig. 19: Dimension definition window
|
|
The two options will open the dataset/dimension metadata available. |
|
|
Addition
or removal of selected Codes to the dimension element. |
|
|
Addition of all Codes to the dimension element |
|
|
Removal
of all Codes from the dimension element |
|
|
The user
can either create a new aggregate under a specific directory, or call an
existing one from a specific directory and edit it. |
|
|
Creation or editing of formulas to be applied during
the extraction. Group details button allows individual selections of a code or codes from a group of codes. |
Note: The advanced options
for Codes selection of: ![]() ,
, ![]() ,
, ![]() are explained further in this section.
are explained further in this section.
Each time the user clicks on a dimension, the system opens a form that
enables the selection of codes, groups or aggregates (groups and aggregates are
not available for all dimension). The user can select dimension elements with
the mouse (more facilities with mouse and shift and or ctrl).
By pressing on key the selection moves to the next code beginning with
this letter.
Example: With the partner dimension, United States is selected by
pressing four times “U”. When a button
group detail is clicked, all the codes that are included in the selected group
will be displayed for individual selection.
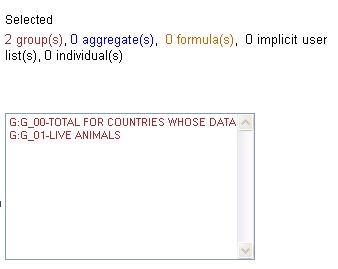
The
user may select a group as a whole or he can open the group and select
individual items. Groups are used by the system to facilitate the access to
large classifications and the selection of classification items. When a group
is selected as a whole, it appears in red colour. However, in the extraction
only the contents of the group are shown.
Example: If a group contains 200 items, the user will
dispose in the extraction all the 200 items and no indication of the group.
Groups may also be added as aggregates to the query.
In this case, the aggregation of all elements that belong to the group is shown
in the extraction.
Example: If a group contains 200 items and is added as
aggregate to the query, the user will dispose only one item in the extraction.
Simple dimension elements can be selected from a
list, from the results of a dimension search or from a hierarchy (hierarchies
are not available for all dimensions).
It is possible to define a query containing for one or more dimensions,
groups, parts of groups, aggregates based on groups, formulas and simple
dimension elements.
Note: An
estimated number of cells is displayed at the bottom left of the screen. If
you select a group, your extraction will contain one row for each code member
of the group. Be aware that some groups may contain many codes and therefore
drastically increase the size of your extraction. Unless you really need
details for all codes inside a group, it is recommended not to use groups, and
rather select individual codes (visible by clicking on the 'Group Details'
button).
Specific codes selection panel:
With this function, the user will be able to mark for extraction an
individual or a specific number of codes from a group of products.
To better understand the Specific Codes Panel an
example is fitting.
For instance, if you require extracting in dimension
PRODUCT only the yogurt codes and since the yogurt is only part of the G: G_04:
DAIRY PRODUCE group, adding the whole group will not accomplish your goal.
Having pressed the Group Details you will open all the
Code details of the dairy products. From the following panel you will have all
available options as per the previous screen at the Group level with the
addition of the Add/Edit Formula.

Fig. 20: Group details window (Specific
Codes Selection)
Add/Edit Aggregate:![]() to create a new aggregate or edit an existing
one.
to create a new aggregate or edit an existing
one.
Add as Aggregate: ![]() only available when the codes are organised in groups
only available when the codes are organised in groups
The use of Aggregate permits the inclusion of aggregation of codes or groups of codes in the extraction. As display above, two options can be available, depending of the content of the dimension (having groups or not).
When the dimension will display
groups, the ![]() will enable the creation of an aggregate containing
the sum of the group contents.
will enable the creation of an aggregate containing
the sum of the group contents.
When the dimension will display
codes, the ![]() will enable the creation of aggregates which
will contains the codes (and or users/system existing aggregates).
will enable the creation of aggregates which
will contains the codes (and or users/system existing aggregates).
Add as Aggregate Process:
Activate Add/Edit Formula will select the group in the
‘Selected’ area. The group will be
displayed in blue:
Add/Edit Aggregate Process:
Activate
this option will open a new dialog for the aggregate generation.
If
you some codes have been selected prior to the activation of the button, the
new dialog will contain the selected codes as definition of the aggregate.
If no codes have been selected, a dialog will
be open with the list of existing aggregates (user and system) which will be
available for selection, edition and deletion.
This
dialog will enable the new aggregates.
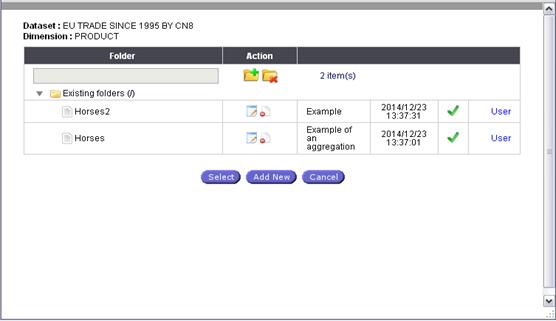
Fig. 21: List of Aggregates
Add Aggregate: Select the aggregate from the list and press the button
![]()
Delete Aggregate: Select the aggregate from the list and press the delete
button ![]()
Edit Aggregate: Select the aggregate from the list and press the edit
button ![]()
Add New Aggregate: Press the add button ![]()
Note: The options “Edit Aggregate” and “Add New Aggregate” will
open a new dialog enabling the definition of the aggregate to be created /
Edited.
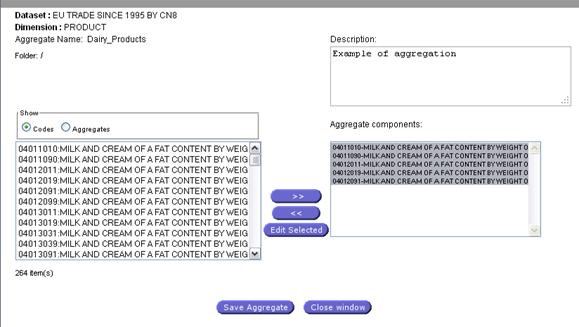
Fig. 22: Aggregates definition panel
From the Aggregate definition Panel, you can select Codes, or Aggregates to be included, using the radio button. System aggregates are on the yellow line.
![]()
Once
define, click on ![]() to create (or Edit) the aggregate.
to create (or Edit) the aggregate.
In addition to the previous available options for the User to add codes
to the extraction plan, a newly introduced option has been added at the Code
level, the formula addition.
With this option the User can invoke predefined system formulas for
selected Codes or create new ones for each specific Dimension Element.
Add/Edit
Formula Process:
The use of Formulas permits the inclusion of calculated fields in the extraction, much in the same way as spreadsheet programs, like Excel.
Because of this our dependency on spreadsheets can be reduced, allowing us to easily obtain answers to familiar problems like:
1. What
is the growth rate of trade between years 1998 and 1999 for a given country? Using
the formula;
rate=(total1999-total1998)/total1998 in the “period” dimension
2.
For a given product and a given declarant
country, what is the percentage of exports to partner country x in comparison
with the total of exports?
Using the formula; XW=(x/world) * 100 in
the “partner” dimension
3.
For a given product, what is the price of the
Ton?
Using the formula; UnitPrice=(val/quantity).
Activate
Add/Edit Formula: The formula selection panel is open. All existing/saved
formulas can be selected and/or edited.
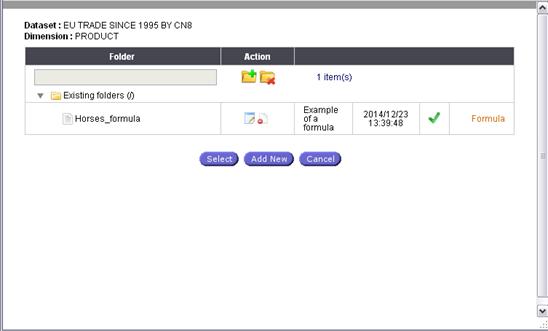
Fig. 23: Formula selection panel
To
add the desired formula to the plan select this formula and press the button ![]()
To
add the new formula press the button ![]()
To
edit an existing formula select the formula and click on ![]()
To
delete an existing formula press the button delete ![]()
Numeric and
String formulas:
These
types of formulas are available only for Indicators. String formula allows the
user to define a text formula.
For
Numeric type of formula the user can select the Precision (number of decimal
digits) and the Scale.
When defining a formula the following Formula Panel Definition will appear:
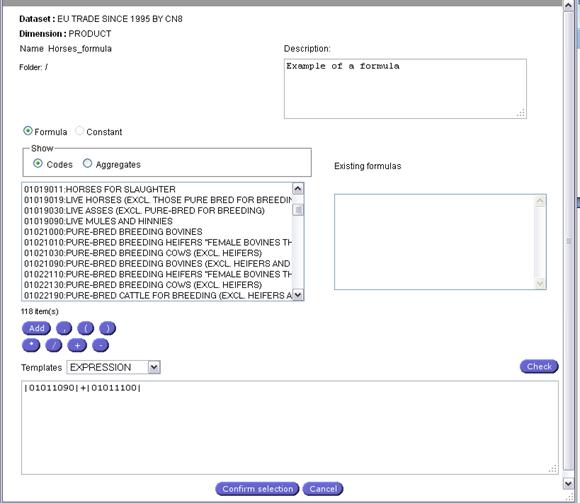
Fig. 24: Formula Definition Panel
A formula can be composed of:
q Codes from the Nomenclature
q Aggregates (under development)
q Formulas
Templates can be used:
q IF – THEN
q IF – THEN – ELSE
q IF – THEN – ELSEIF
Note:
The syntax of the formula will be checked against the system expected values.
If the syntax is incorrect a message will appear to avoid syntax errors. Additionally,
the system checks the formula text for embedded aggregates or formulas. If
found, the system does an extra check that the embedded aggregates/formulas
exist. The system will not check for mathematical errors. For common
mathematical issues (division by 0) the system will not fetch any information
at the extraction (Step 3) for the dimension/formula affected.
Show
Code History button, found in Group Details screen, will be available when
changes occur over the time in the classification of codes. This button will
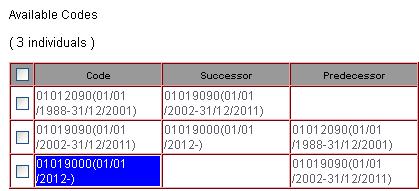
display the code history in the following dialog:
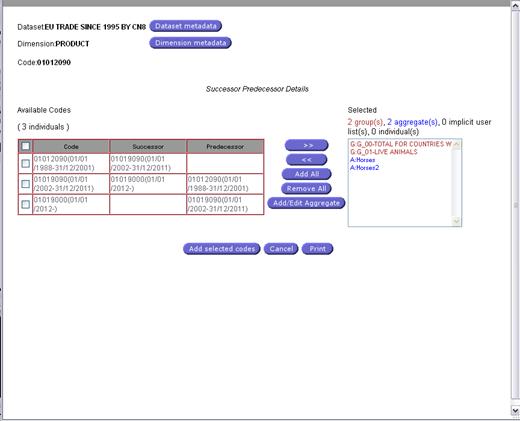
Fig. 25: Code History dialog
The code history dialog will
display the list of all codes involved
in the evolution of the selected code as well as its property (Successor or
Predecessor) and the validity period of the codes. The selection buttons
remains available.
The Successors / Predecessors codes are
hyperlinks, clicking on them the system will scroll and highlight the code at
the first column.
Hovering the mouse
over a Successor / Predecessor code will display the code label as a tool tip:
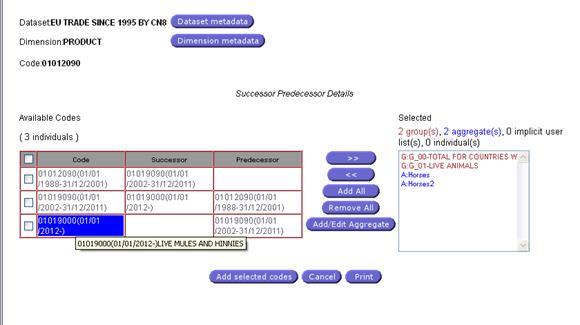
Fig. 26: Successor/Predecessor dialog
‘Show Code History’
can be used as an alternative for code selection, adding or remove them; window
presents all the selection tools as the Dimension selection window.
The
check box on the first row allows select or deselect all the available codes
from the Available Codes List.
In
addition all the displayed information can be printed using the ![]() button
button
Browsing the
Hierarchy: ![]()
When the
button “By hierarchy” is clicked, a
hierarchy of single codes is displayed.
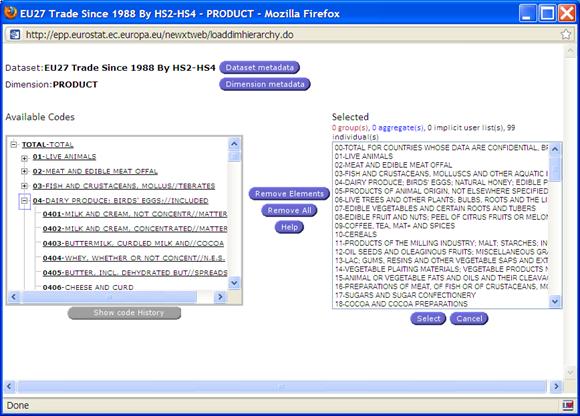
Fig. 27: Browsing the Hierarchy
The Show Code History, accessed from “Advance Selection: By
Hierarchy”, has the same functionality as the one
accessed through Group Details button.
Note: The hierarchy option will
be available only if the dimension contains multiple levels of codes and if
there is a relation available for browsing the hierarchy from one level of the
classification to another. When not available the button will be greyed out.
By Search facilities:
By Search: When this button is clicked, a new form is
opened that allows searching for codes according to the following criteria’s:
Search by Labels: User can Search according to the
Label. 3 options are available:
-
Finding a code by the exact label
-
Finding a code containing all the word entered by the user
-
Finding a code having in the Label, any of the word entered by the user
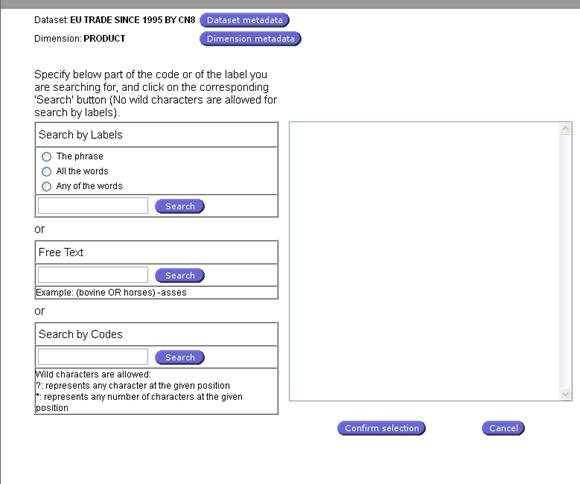
Fig. 28: Selection by search
Free Text: User can type free text.
Search by Codes: User can Search
according to the Code. The user will have to enter a pattern with the following
wild characters:
-
?: representing any characters at the given position
§ For example, 01?? Will select of the 4 digits codes of
chapter 01
-
*: Representing any number of characters at the given position
§ For example, 01* Will select of codes of chapter 01
(without any distinction of the number of digits)
Once the
selection has been done, the ![]() button will confirm the selection in the adequate dimension
of the query.
button will confirm the selection in the adequate dimension
of the query.
By Code
facilities:
When the button “By Code” is
clicked, a new sub form allows users to enter the code. Only individual
codes are accepted, group codes cannot be added with this function. The sub
window is located under the “Search Buttons”.
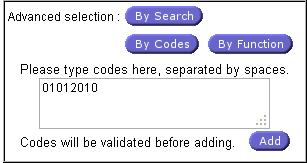
Fig. 29: Advanced search
By
Function facilities:
When the button “By Function” is
clicked, a new sub form allows users to enter a function (last code, from to
codes, containing a specified string, all codes). The selected function will
then be considered as an Implicit User list.
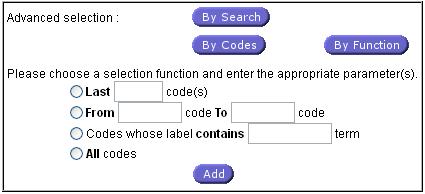
Fig. 30: Filter by function
When
the advanced searching function has been used, the “Select” Button will confirm
the selection.

![]() When the content of each
dimension has been defined, a click on the
When the content of each
dimension has been defined, a click on the ![]() button will proceed to Step
2 of the extraction process. Alternatively you can continue directly to the
selection of outputs by pressing the button.
button will proceed to Step
2 of the extraction process. Alternatively you can continue directly to the
selection of outputs by pressing the button.
Click
on 2.Layout Selection to proceed to step 2
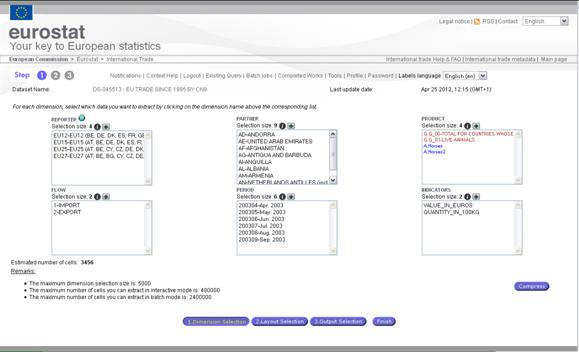
Fig. 31: Summary of extraction query
Note: The compress ![]() button enables the system to
check the data availability and when possible, reduce automatically the “unused
codes”. This will reduce the number of cells of your extraction. Please be
aware that the compressed extraction may contain no data.
button enables the system to
check the data availability and when possible, reduce automatically the “unused
codes”. This will reduce the number of cells of your extraction. Please be
aware that the compressed extraction may contain no data.
Existing query options
As
mentioned above in this user guide, the ‘Existing query’ options have been
enhanced in order to provide users with additional functionalities, such as:
·
Import
/ Export of query definition (including user and system aggregates and
formulas)
·
Enable
the multiple query selection (for deletion)
·
Set
Auto Extract option on some existing queries
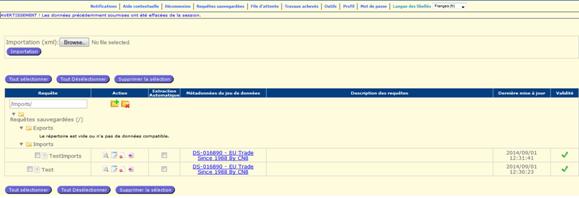
Fig. 32: Existing query window
Folder
management
![]()
![]() Queries can be stored in different
folders which the user can create and delete. To create a new folder press
button add new folder , to delete the
folder select it and press
Queries can be stored in different
folders which the user can create and delete. To create a new folder press
button add new folder , to delete the
folder select it and press
Note: Only empty folder can be deleted.
Import / Export of query:
Easy Comext offers the option of saving files containing queries or user lists at defined locations and transferring them back to the system when necessary. This option is very useful for exchanging queries (and user lists) between users. The output format is an XML file.
Export query:
To export a query, select the ![]() export button
of the “Action” section, corresponding to the query to be exported.
export button
of the “Action” section, corresponding to the query to be exported.
This action will open a dialog to specify the folder in which the XML file will be saved:
Click on save button.
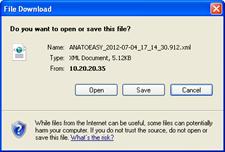
Import query:
A query, previously exported from Easy Comext can be imported. To launch an importation process, use the following option:

Fig. 33: Import Plan
The ![]() button will enable the selection of the XML
file to be imported. The
button will enable the selection of the XML
file to be imported. The ![]() button will start the import procedure.
button will start the import procedure.
Note: If the XML file to import contains already existing information (query, user objects such as aggregates or formulas, Easy Comext will ask for a confirmation to overwrite the existing information:
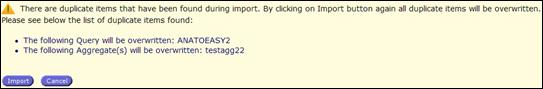
Fig. 34: Warning for overwriting query or
user objects
Enable multiple query selection for deletion
This feature will enable the selection of one or several queries
for deletion. The query selection can be done by a click on the check box
available on the “Selected” column or by the following buttons: ![]() .
.
Once the selection has been done, the button ![]() will remove the query from your Easy Comext
query repository.
will remove the query from your Easy Comext
query repository.
Auto Extract (Existing query)
As mentioned above in this user guide, a new
function has been added to enable users to launch automatic extraction when the
dataset with which the query has been done is updated. This function is called
“Auto Update” and is available on the Existing query panel.
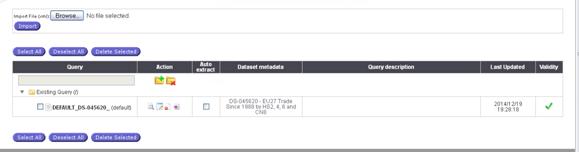
Fig. 35: Auto Extract option
You can set
the option “Auto Extract” to a saved query. Easy Comext will launch an
extraction each time the related dataset will be updated and you will receive
an email for notification. The auto extract option is enabled only for users
with email.
 Step 1: Extraction
query definition: method 2
Step 1: Extraction
query definition: method 2
Selecting
the option New Text Query a Text query editor will open and allow to create a
text based query.
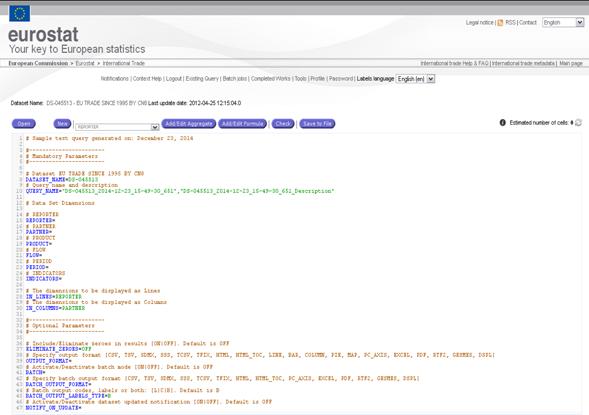
Fig. 36 Text Query
editor
The following rules will be applicable for the correct definition of the syntax of the text query properties file:
|
Definition |
Description |
|
ItalicText |
Keyword |
|
[...] |
Optional element |
|
[...]* |
Optional repeatable element |
|
[...]+ |
Repeatable element with at least one
occurrence |
|
[ItalicText] |
Optional Keyword |
|
[ItalicText ...]+ |
Repeatable keywords, see also repeatable
parameters. Elements in the enumeration will not be separated by any special
character. |
|
[ItalicText1… | ItalicText2… |… ] |
Choice between two or more elements. |
|
[ItalicText1… | ItalicText2… |… ]? |
Optional choice between two or more elements. |
|
<Text> |
Parameter |
|
[<Text>] |
Optional Parameter |
|
[<Text>]+ |
Repeatable parameters. The elements in the
enumeration will be separated by comma. Ex: Key1, Key2, Key3 |
Note: The EASY Comext application offers the possibility to store the definition of queries in text files. The text files are simple plain text .properties files, where values are stored in KEY=VALUE pairs.
The .properties files allow the user to define a query which contains various types of fields and outputs. For consistency purposes the users are advised to use “.properties” for the extension of the files in which they store the query definitions.
Query Definition
Each line has a KEY =
VALUE entry and must be terminated
by ENTER.
Example:
DATASET_NAME=DS-045513
Note: Incorrect
example: DATASET_NAME=DS-045513; The last character ‘;’ in such case, the dataset name will be considered as ‘DS-045513;’ and it will fail on validation.
The KEY must contain only letters, numbers and
underscore ‘_’ and be uppercase.
The VALUE format is CSV
(comma separated values), where multiple values (if the case) are separated by
commas ‘,’. The value can have zero, one or many entries.
The allowed format for
VALUE is:
·
VALUE1 or
“VALUE 1” (using double quotes)
Multiple
values are specified like:
·
VALUE1,VALUE2,VALUE3
or “VALUE1”,”VALUE2”,”VALUE3” (using double quotes)
Note: If the VALUE is not quoted, only letters, numbers and underscores
‘_’ are allowed.
Example: REPORTER=EU25
Note: Incorrect
example: REPORTER=FR,EU 25 (EU 25 is incorrect, no spaces without quotes)
If the VALUE is quoted,
value can contain spaces and other characters.
Example: REPORTER= “EU
25”, “FR” (spaces and other characters are allowed between quotes.
Note: Incorrect
example: REPORTER=”FR”,EU 25 (EU
25 is incorrect, no spaces without
quotes)
The following syntax is used to define a Query:
DATASET_NAME = <DATA_SET_NAME>
QUERY_NAME = <”QUERY_NAME”>,
[<”QUERY_DESCRIPTION”>]
<DIMENSION_NAME> = <CODE_1>+, <A:AGGREGATE>+, <F:FORMULA >+,
<S: AGGREAGTE_GROUP >+, <G:GROUP >+
IN_LINES = <DIMENSION_NAME_1>+
IN_COLUMNS = <DIMENSION_NAME_1>+
ELIMINATE_ZEROES
= <[ON|OFF]>
OUTPUT_FORMAT =
<OUTPUT_FORMAT_TYPE>
BATCH = <[ON|OFF]>
BATCH_OUTPUT_FORMAT
= <[BATCH_OUTPUT_FORMAT_TYPE]>
BATCH_OUTPUT_LABELS_TYPE
= <[L|B|C]]>
Mandatory Parameters:
DATASET_NAME =
<DATA_SET_NAME> -> The dataset
name. Mandatory.
QUERY_NAME =
<”QUERY_NAME”>, [<”QUERY_DESCRIPTION”>] -> The name of the query (mandatory). Can be simple as in
<”MY_QUERY”> or preceded my folder definition as in:
<”/folder1/MY_QUERY”>, followed by the optional Query description;
<DIMENSION_NAME> = <DIMENSION_ELEMENT>+ -> the name of the dimension,
followed by one or more dimension elements (mandatory), where dimension
elements can be:
<CODE_1>+ -> One or more dimension code;
<A:AGGREGATE>+ -> One or more aggregate of the current dimension;
<F:FORMULA>+ -> One or more formula
of the current dimension;
<S:AGGREGATE_GROUP>+ -> One or more aggregate groups of
the current dimension;
<G:GROUP>+ -> One or more groups of
the current dimension;
Every dimension is mandatory to have at least
one value.
IN_LINES = <DIMENSION_NAME_1>+
-> Specifies which dimensions
(one or more) will be displayed as LINES of the result. Mandatory.
IN_COLUMNS = <DIMENSION_NAME_1>+
-> Specifies which dimensions
(one or more) will be displayed as COLUMNS of the result. Mandatory.
Optional Parameters:
ELIMINATE_ZEROES = <[ON|OFF]>
-> Include/Eliminate zeroes in results [ON|OFF]. Default is OFF;
OUTPUT_FORMAT =
<OUTPUT_FORMAT_TYPE> -> The
type of the desired output (EXCEL, CSV, PDF, etc);
BATCH = <[ON|OFF]> ->
Activate/Deactivate batch mode [ON|OFF]. Default is OFF;
BATCH_OUTPUT_FORMAT = <[
BATCH_OUTPUT_FORMAT_TYPE]> -> Specify batch output format (CSV,EXCEL,
etc)
BATCH_OUTPUT_LABELS_TYPE = <[ BATCH_OUTPUT_LABELS_TYPE]> ->
Batch output codes, labels or both: [L|C|B]. Default is B
NOTIFY_ON_UPDATE = <[ON|OFF]> -> Activate/Deactivate dataset
updated notification [ON|OFF]. Default is OFF.
Below is a full query example:
# Sample text query generated on: 2013-11-14 13:22:43.077
#-----------------------
# MANDATORY PARAMETERS
#-----------------------
# Data Set EU TRADE SINCE 1995 BY CN8
DATASET_NAME=DS-045513
# Query name and description
QUERY_NAME=DS-045513_BATCH
# Data Set dimensions
# REPORTER
REPORTER=EU25
# PARTNER
PARTNER=US
# PRODUCT
PRODUCT=G:G_TOTAL
# FLOW
FLOW=1,2
# PERIOD
PERIOD=200310,200311
# INDICATORS
INDICATORS=QUANTITY_IN_100KG,SUPPLEMENTARY_QUANTITY,VALUE_IN_EUROS
# The dimensions to be displayed as Lines.
IN_LINES=REPORTER
# The dimensions to be displayed as Columns.
IN_COLUMNS=PARTNER
#-----------------------
# OPTIONAL PARAMETERS
#-----------------------
# Include/Eliminate zeroes in results [ON|OFF]. Default is OFF
ELIMINATE_ZEROES=OFF
# Specify output format [CSV, TSV, SDMX, SSS, TCSV, TFIX, HTML,
HTML_TOC, LINE, BAR, COLUMN, PIE, MAP, PC_AXIS, EXCEL, GESMES, DSPL]
OUTPUT_FORMAT=
# Activate/Deactivate batch mode [ON|OFF]. Default is OFF
BATCH=ON
# Specify batch output format [CSV, TSV, SDMX, SSS, TCSV, TFIX,
HTML, HTML_TOC, PC_AXIS, EXCEL, GESMES, DSPL]
BATCH_OUTPUT_FORMAT=CSV,EXCEL
# Batch output codes, labels or both: [L|C|B]. Default is B
BATCH_OUTPUT_LABELS_TYPE=B
# Activate/Deactivate dataset updated notification [ON|OFF].
Default is OFF
NOTIFY_ON_UPDATE=OFF
Note: The user can insert comments inside the text query properties file. A line from the file will be marked as a comment line by using sharp character (‘#’) in the beginning of the line.
EX:
#This is a comment line
![]() Displays the system open dialog allowing the
user to open an existing text query file (only .properties files can be opened).
If the current query is modified and unsaved, asks for confirmation.
Displays the system open dialog allowing the
user to open an existing text query file (only .properties files can be opened).
If the current query is modified and unsaved, asks for confirmation.
![]() Creates a new empty text query. If the current
text query is modified and unsaved, asks for confirmation.
Creates a new empty text query. If the current
text query is modified and unsaved, asks for confirmation.
![]() Verifies the text query syntax. In case of errors, provide error messages
indicating the user where to perform corrections.
Verifies the text query syntax. In case of errors, provide error messages
indicating the user where to perform corrections.
![]() Saves the current text query into a
.properties file. The user will be prompted for the new file name.
Saves the current text query into a
.properties file. The user will be prompted for the new file name.
![]() Saves and submits the text query. Performs systematic syntactic checks before
query submission and in case of errors, provide error messages indicating the
user where to perform corrections.
Saves and submits the text query. Performs systematic syntactic checks before
query submission and in case of errors, provide error messages indicating the
user where to perform corrections.
![]() Opens Select
Object window with all the available aggregates for the current user and
dataset and the dimension selected in the box at the top of the text query
editor. Selected aggregate is added on the position of cursor.
Opens Select
Object window with all the available aggregates for the current user and
dataset and the dimension selected in the box at the top of the text query
editor. Selected aggregate is added on the position of cursor.
![]() Opens Select
Object window with all the available formulas for the current user and dataset
and the dimension selected in the box at the top of the text query editor.
Selected formula is added on the position of cursor.
Opens Select
Object window with all the available formulas for the current user and dataset
and the dimension selected in the box at the top of the text query editor.
Selected formula is added on the position of cursor.
![]() Allows the user to display an estimated number
of cells for the current text query. The query must be valid for this button to
perform. If the query is not valid, displays -1 in red.
Allows the user to display an estimated number
of cells for the current text query. The query must be valid for this button to
perform. If the query is not valid, displays -1 in red.
![]() If checked
(default is off), when saving a text query to file, the query is saved
disregarding the errors, allowing the user to save an incorrect text query to
file for later editing.
If checked
(default is off), when saving a text query to file, the query is saved
disregarding the errors, allowing the user to save an incorrect text query to
file for later editing.
![]() If checked
(default is off), allows the user to display the results (by clicking the
Finish button) in a new window instead of the current one.
If checked
(default is off), allows the user to display the results (by clicking the
Finish button) in a new window instead of the current one.
Note: If the number of estimated cells exceeds 120 000
extraction will be sent in batch regardless the definition of Batch value in
the text query. If the number of estimated cells exceed 1 800 000
extraction will be blocked and user will be prompted to reduce number of
elements.
Step 2: Extraction Layout definition
![]()
The user can define the
layout of the display/presentation of the extracted data. Up to five header columns and five header rows can be defined.
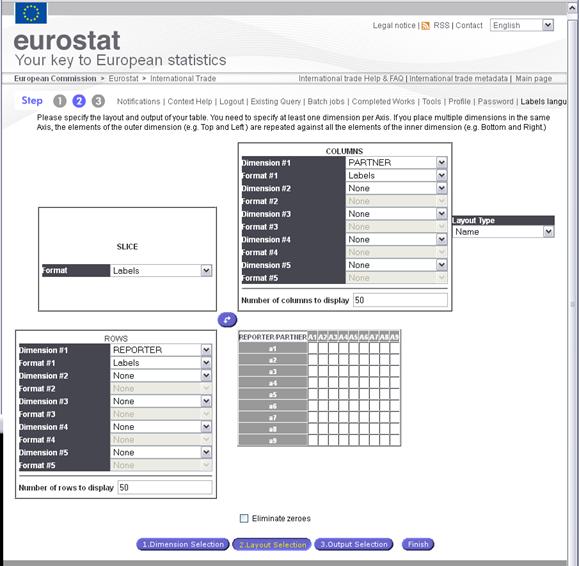
Fig. 37: Layout definition (Step 2)
For each line or column
the user selects to display codes,
labels or both
For The remaining dimensions
(which have not been put in the table), select the output format in the SLICE sub window
When the output table has been
defined, users have to click on the ![]() button to
access the Step 3 (Last step of the extraction process).
button to
access the Step 3 (Last step of the extraction process).
Note: The option “Eliminate Zeroes” will remove the “codes”
not in use in the extraction.
The Number of rows and columns to display must
be lower or equal to 100.
Step 3: Extraction
Option /Submission
![]()
This last step of the extraction
will be different according to the status of the user. A non-registered user
will only have the possibility to launch the extraction in Interactive mode.
While a registered user will be
able to specify if the extraction is to be launched in Interactive mode or in
Batch mode, a non-registered user will only be able to submit Interactive
extractions.
If the submission is interactive, the user should wait until Easy COMEXT
has extracted and prepared the data for display.
The submission is launched through the following screen (not logged in
users)
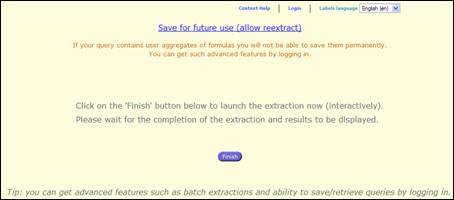
Fig. 38: Submit an extraction (not registered
users)
As mentioned here above, a
logged-in user will have access to several options reaching step 3:
-
Execute a remote extraction and visualise the results or download formatted
files later
-
Be informed by mail when the dataset use for the extraction is updated
-
Save the extraction query in the specified
folder and enable the Auto Extraction when the dataset will be updated
-
Define the format of
the file to be generated with the extraction’s results.
When
the registered user requests a batch extraction, the notification message will
be sent via email. This email will contain also the selected output(s) and is
sent up to 5mb. In the case of
larger size the email message will prompt the user to login into the system for
retrieving it.
When the user selects the
“interactive extraction” (not batch), the result of the extraction will be
displayed, but the user can also generate the output file(s) in one (or
several) available formats (Excel, CSV, SDMX, Text, PDF, RTF2 etc.).
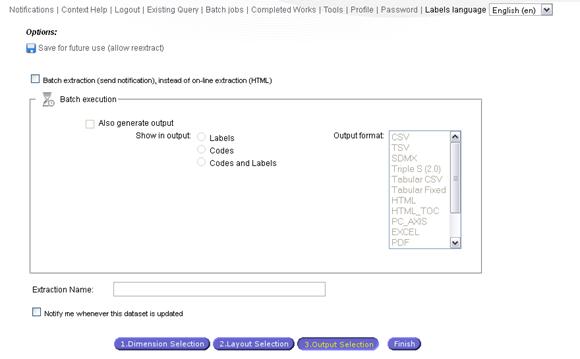
Fig. 39: Submit an extraction (Registered
users)
When a batch job is launched the user can visualise the processing status
through the link “Batch Jobs” on the main Toolbar. The Refresh button renews
the state status of the extractions.
The following window is displayed:
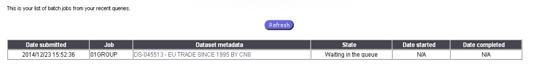
Fig. 40: Batch Jobs
When the submitted batch job’s State
is completed, it’s added to the list
of “Completed works”.
To access the following window, displaying the extractions
submitted in Batch mode and saved under the user account, user have to click on
the link “Completed work” from the
main Toolbar.
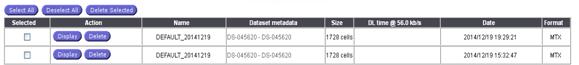
Fig. 41: Completed Works window
Note:
According to the selection made under the step 3 (Extraction options), users
will be able to display ![]() the extraction or to download
the extraction or to download ![]() the output file (EXCEL, CSV, etc.).
the output file (EXCEL, CSV, etc.).
Multiple selections of completed
extractions can be done via the check box or using the buttons ![]() . The delete
option is available via the
. The delete
option is available via the ![]() button
button
Display the result of an extraction:
An
extraction can be displayed either after an interactive extraction or after
clicking on the “Display” button associated to the extraction list in the
completed work window.
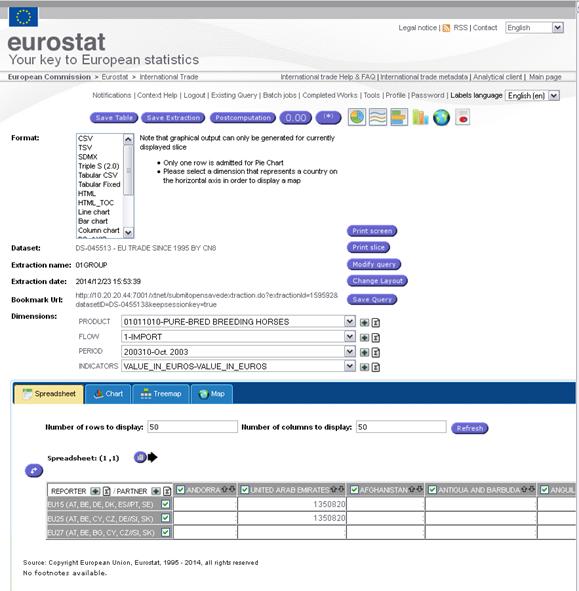
Fig. 42 Display of an Extraction
At this stage, the user is given the following
options:
Ø
Make
new selection in the Header dimensions (Product, Indicators...)
Ø
Print
Slice
Ø
Pivot
the Slice
Ø
Modify
Query (a new extraction will be done)
Ø
Change
Layout
Ø
Save
query (only for registered users)
Ø
Perform
Post computations on the resulted extraction (Sum, Average, Count, Percentages,
Growth Rate)
Ø Save table or Extraction: download the data (view or all) in
the requested format (Excel, CSV, HTML, etc.).
Ø
View
dataset or Dimension metadata
Ø
Generate
Graphics (Lines or Pie)
Ø
Generate
and browse interactive charts
Ø
Generate
Treemap
Ø
Generate
Maps
Ø
Show
or hide footnotes
Ø
Perform
computations on the extraction
Ø
Obtain
a report on the extraction including data, graphs etc.
Ø
Sort
the results ascending/descending order.
Ø
Update
elements in the dimension via Plus sign
Ø
Add
formulas from the spreadsheet
Update the spreadsheet
The user
can update the elements in the dimension by pressing plus sign ![]() . This
button is available behind the each dimension. New window is opened and
contains elements available for the selected dimension.
. This
button is available behind the each dimension. New window is opened and
contains elements available for the selected dimension.
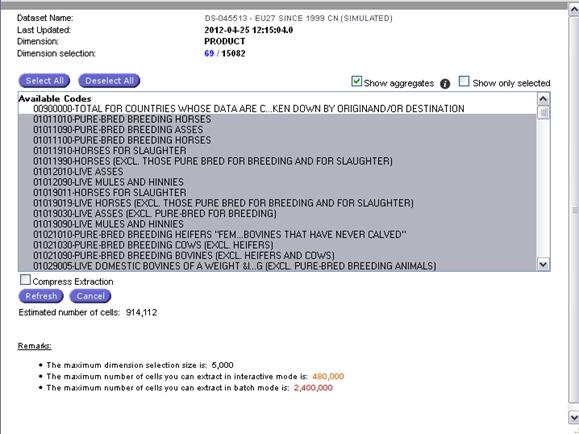
Fig.
43: Display of an Extraction
Buttons
Select All and Deselect All are available. User can check or uncheck boxes ![]() and
and ![]() . To
compress the extraction check the box
. To
compress the extraction check the box ![]() . When the
selection is ready press button
. When the
selection is ready press button ![]() and spreadsheet will be updated according to
the selection, press button
and spreadsheet will be updated according to
the selection, press button ![]() to cancel the spreadsheet update.
to cancel the spreadsheet update.
Add the formula to the spreadsheet
To add the
formula to the dimension press formula icon ![]() available behind the each dimension
available behind the each dimension ![]() . Formula
definition screen is opened but formula can be based only on elements
available in the current extraction. In order to compute the formulas, the new
extraction will be based on the available data, i.e. data will not be extracted
from the database. Define the
formula and press button
. Formula
definition screen is opened but formula can be based only on elements
available in the current extraction. In order to compute the formulas, the new
extraction will be based on the available data, i.e. data will not be extracted
from the database. Define the
formula and press button ![]() to add the formula to the spreadsheet.
to add the formula to the spreadsheet.
Make a new selection in the Header dimensions
(Product, Indicators,..)
The
Dimension which has not been put into the table remains as Headers.
Consequently, only one code of each header’s dimension can be used to present the
table.
Users can
change the code selection by clicking
on the Dimension drop down selection box and select another code in the list
displayed.
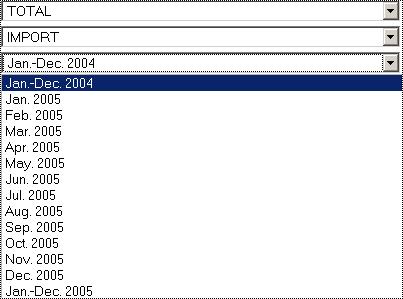
Fig. 44: Selection of another code in a
Header dimension
Change layout of the table
To change
the layout of the table, users have to use the![]() button. This option will bring user
to the window where the table presentation is to be defined.
button. This option will bring user
to the window where the table presentation is to be defined.
This window
is similar to the step 2 of the extraction procedure. Once the presentation has
been defined, the![]() button will display the table
accordingly.
button will display the table
accordingly.
Print screen
The print screen button![]() will provide a print preview of the
data displayed on the screen (which may be only a part of the table)
will provide a print preview of the
data displayed on the screen (which may be only a part of the table)
Print slice
The print screen button ![]() will
provide a print preview of whole extraction, cut in slice.
will
provide a print preview of whole extraction, cut in slice.
The Slice
of the extraction can be displayed on the screen using the following icon: ![]()
 The following “slide selection” sub
window appears:
The following “slide selection” sub
window appears:
Enabling
users to display a selected slide:
Modify Query
The modify
query button ![]() will enable you to change the description of your extraction. This
selection will enable you to proceed to a new extraction with the new defined
query.
will enable you to change the description of your extraction. This
selection will enable you to proceed to a new extraction with the new defined
query.
Save table / Save Extraction
The Save table ![]() or Save Extraction
or Save Extraction ![]() buttons will enable you to save the displayed Table or the entire table.
The output format is to be defined before clicking on the “Save” buttons. The following
options are available:
buttons will enable you to save the displayed Table or the entire table.
The output format is to be defined before clicking on the “Save” buttons. The following
options are available:
CSV
TSV
HTML
HTML_TOC (Table of
Contents)
SDMX
Triple S (2.0)
Tabular CSV
Tabular Fixed
Line chart
Bar chart
Column chart
PC_AXIS
GESMES
EXCEL
DSPL
PDF
RTF2
View dataset or Dimension metadata
Metadata
can be accessed at three levels:
Ø From the main toolbar the user can
have a global metadata covering all
datasets
Ø From each dataset the user may
access metadata related to the specific
dataset
Ø From each dimension the user can
access metadata related to this
dimension
All files
can be downloaded or opened.
In general
the user can find metadata related to methodology, classification, quality,
timeliness information and update information, important notices and software
The
available metadata information will increase and improve continuously.
 Generate Static
graphics and Map
Generate Static
graphics and Map
The user
can generate 4 static graphic types:
![]()
-
Line
-
![]() Pie
Pie
-
Bar
![]()
o
Horizontal
![]()
o
vertical
![]()
-
Map
Note: The
Line & Bar graphics require that
less than 10 rows are displayed in
the table
The
Pie and the Map graphic only permit one
row.
Example of Line Graph:
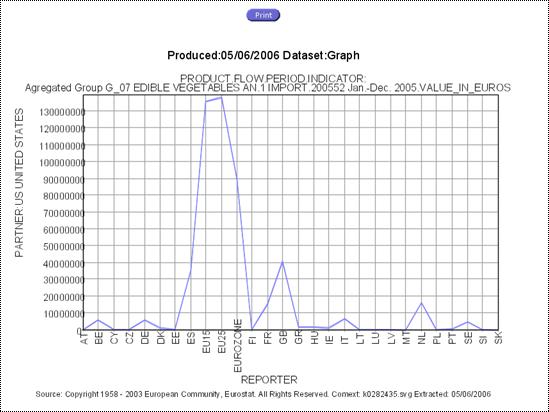
Fig. 45: Static Line graph
Example of Pie Graph:
Fig. 46: Static Pie graphic
Map parameters:
To generate a Map with easy COMEXT, users must give a name to the Map
(Title) and can also define colours according to the range of values. These
selections are to be done under the following window:
Fig. 47: Map Parameters (Title and Colours
specifications)
Once the
Map specifications have been given, click on![]() to obtain the Map
to obtain the Map
Example of
a Map: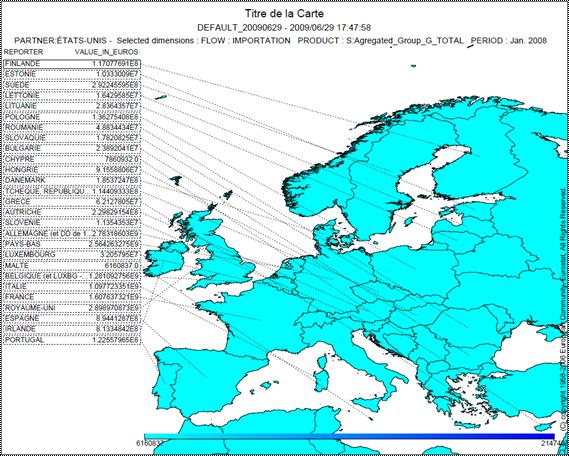
Fig. 48: Map
Show or
hide footnotes
The button![]() enable user to show or hide
footnotes when necessary.
enable user to show or hide
footnotes when necessary.
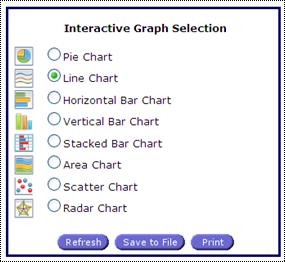
Generation of interactive
Charts
The user can
generate 8 interactive Chart types by selecting the “Chart button” at Step 3
of the extraction: ![]() .
.
The available Chart options for the users are:
-
Pie
-
Line
-
Bar
o
Horizontal
o
Vertical
o
Stacked
-
Area
-
Scatter
-
Radar
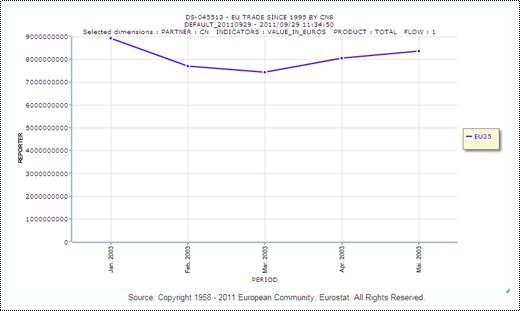
Example of an Interactive
Line Chart:
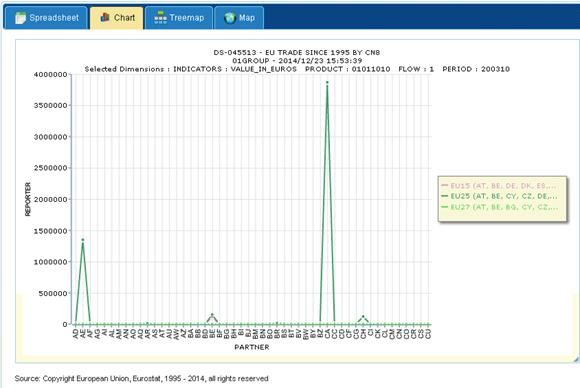
Fig. 49: Interactive Line Chart
The values can be interactively browsed just hovering the mouse over the
graphs. A tooltip will appear along with the corresponding value hovered over
the mouse, which will include the dimension and specific values information.
Example of Interactive
Pie Chart:
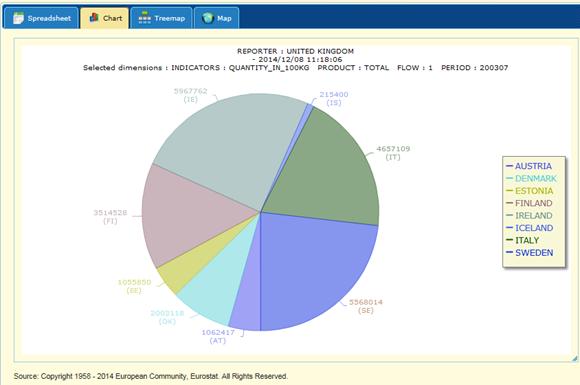
Fig. 50: Interactive Pie Chart
Change Interactive Chart Type
The user can select by clicking on the radio buttons any available type of Chart based on the extracted spreadsheet.
The button ![]() will trigger the generation of the newly
selected chart type and the new chart will be displayed to the user’s screen.
will trigger the generation of the newly
selected chart type and the new chart will be displayed to the user’s screen.
Note: The
Stacked Bar Chart needs at least two rows to be selected to be
displayed.
The
Pie Chart only permits one row to be displayed.
If
the above conditions are not met, the corresponding buttons will be disabled
for selection.
Save Interactive Chart
The user has the option to save any Chart currently displayed on the screen.
To do so, click on the ![]() button. A dialog will open to save the chart
as a PNG image:
button. A dialog will open to save the chart
as a PNG image:
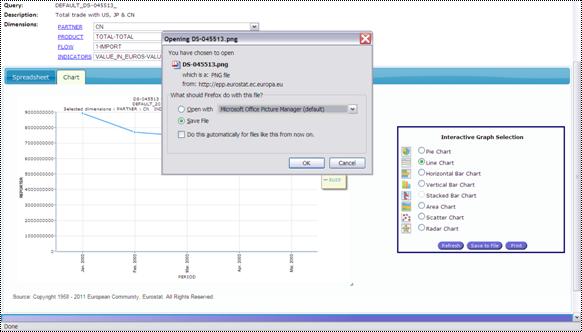
Fig. 51: Save Interactive Line Chart
Save the chart on your preferred location. The Chart’s image is available for display:
Note: The
Chart can be resized from the bottom
right corner. Any size modification will be also reflected at the saved
image.
Print Interactive Chart
The user has the option to print any Chart currently displayed on the screen.
To do so, click on the ![]() button. A new tab will open generating the
print preview.
button. A new tab will open generating the
print preview.
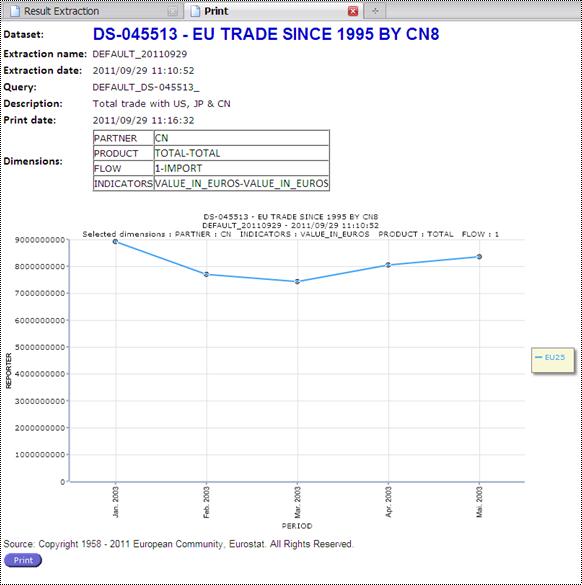
Fig. 52: Print Interactive Pie Chart
Print the chart on your preferred printer.
Generation of Treemap dynamic chart
The treemap visualization contains only data from the current slice as the rest of the interactive charts. The maximum number of elements to display is the same as in the spread sheet (a configured parameter with default value of 50, max value of 100). The treemap Chart can be saved and printed by button Save to file and Print as other graphs. The options Strip and Squarified are available on the right panel.

Fig.53: Treemap
dynamic chart
Note: If
the selection is not suitable for the Treemap visualization or exceeds the
limits (maximum number of elements allowed) the user is informed via a proper
message and no Treemap is rendered.
Generation of geographic map
Select tab ![]() to generate the Geo map. The only one row is
admitted for the map and only dimensions compatible with the map must be in the
extraction table.
to generate the Geo map. The only one row is
admitted for the map and only dimensions compatible with the map must be in the
extraction table.
Example of
a Map:
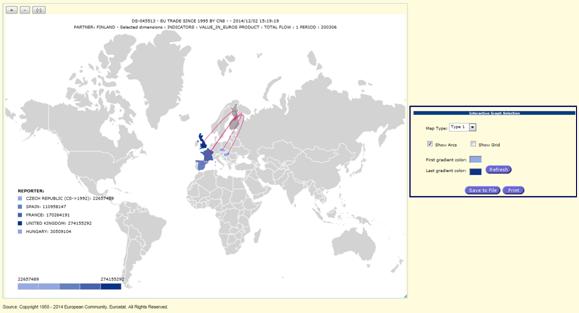
Fig.
54: Display of an Extraction
The size of
the map can be increased by the ![]() button in the top left corner. Press button
button in the top left corner. Press button ![]() to show the default map size.
to show the default map size.
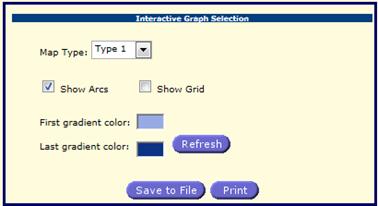
The user
can change the map type in Interactive Graph Selection Panel. Three types are
available. The user can also check or uncheck boxes ![]() and
and![]() . Press
. Press ![]() to save the map and press
to save the map and press ![]() to print it. The colors can be updated by
clicking to the colored areas
to print it. The colors can be updated by
clicking to the colored areas ![]() and
and ![]() .
.
 Perform computations on the extraction
Post computations option enables users to perform processing on the
results of the extraction:
The operation selection
will be done using the following dialog:
Selection of dimensions
on which the processing will be applied Selection of axis (X, Y
and Z) and processing type![]()

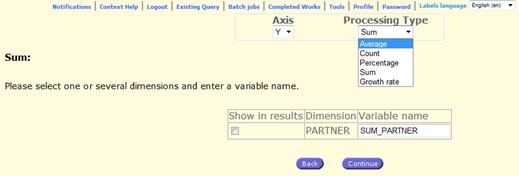
Fig. 55: Post computation selection
 Once the axis and the processing Type
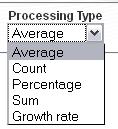 have been selected, the
 ![]() button will launch the post computation and the result
will be displayed.
button will launch the post computation and the result
will be displayed.
Sum
The sum will be
processed on the dimension(s) selected previously
Percentage
When clicking on the
computations button (processing type: percentage the percentage is computed and
the name for the new indicator(s) that is (are) created (PERCENT_DIMENSION NAME)
Growth Rate
User can select the only
Period dimension and axis selection is disabled. The basic Growth rate
computation will be performed.
 Decimals
format:
Decimals
format:
When clicking on the Decimal button, (percentage), the
following form allows specifying the decimal format for each indicator of the
table:
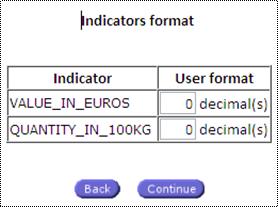
Fig. 56: Indicator selection for User format
 Click on ‘continue’ to validate the
selection.
Click on ‘continue’ to validate the
selection.
 Report
This option enables the production of report including (according to
user selections, the table, and /or graphs and Map). The content selection is
done via the following dialog: 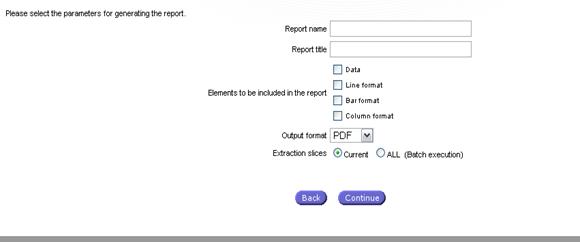
Fig. 57: Report content selection
Report formats PDF, RTF
and HTML are available. Extraction Slices radio buttons allow either all the extraction slices to be
generated in the report or only the
current displayed slice (default selected).
Note: The
list of available elements to be included in the selection in the report is
subject to the same limitation as for the charts:
The Line & Bar graphics require that less than 10 rows are displayed in the table
The
Pie and the Map graphic only permit one
row.
If E-mail Report is
selected the report will be send by e-mail (zip attached archive) to the user’s
email address after the report is generated. If the size of the report is too
big for email system user will receive email without attachment and have to
login to retrieve it in Completed Works.
Note: If the
selection exceeds the limits of the current extraction (number of cells/rows)
the Report will not be presented directly to the user and will be executed in
Batch mode. If the user is anonymous, the ‘All’ radio button and ‘E-mail
Report’ checkbox will be disabled.
NOMENCLATURES
and RELATIONS
Introduction
On the main page, Easy COMEXT
displays the list of Available Nomenclatures and Relations between
nomenclatures:
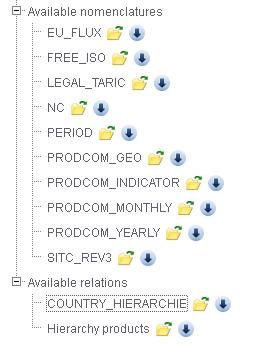
Fig. 58: Available nomenclatures and Relations
When selecting a nomenclature / relation, a floating menu will enable
user to open or download the nomenclature/relation.
Open a nomenclature
Selecting ![]() in the floating menu will open the following
dialog:
in the floating menu will open the following
dialog:
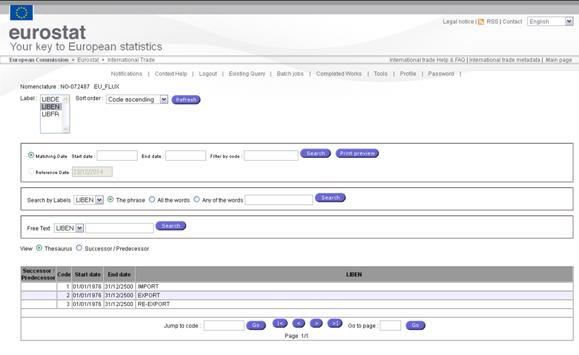
Fig. 59: Nomenclatures
When a Nomenclature is open, Easy Comext display the codes, the validity
period (when relevant) and the Labels. On the top of the dialog, several options
are available to enable users to change the display or (and) to perform a
search.
The
available options can be split in two categories, display and filter
Display options:
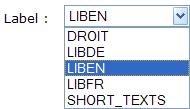
Label:
This drop down menu will display the list of the available labels
![]()
Fig.
60: Nomenclatures’ labels
Sort order:
This drop down menu will enable users to select the sort order
(ascending / descending) according to the codes or Labels
![]()
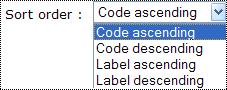
Fig. 61: Sort order options
Print Preview:
A nomenclature or a relation can also be printed. The command button
Print Preview will open a dedicated window ![]()
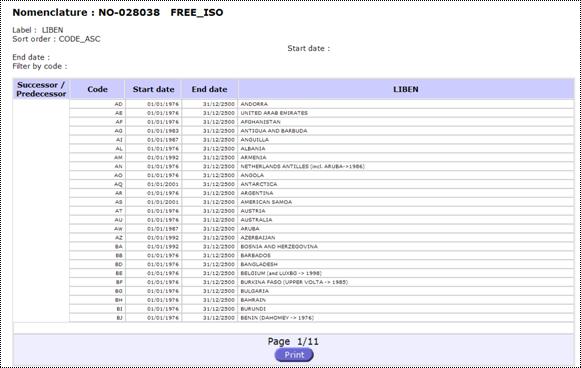
Fig. 62: Print preview
View Thesaurus,
Successors / Predecessors:
The view option will give access to the Thesaurus or Successors /
Predecessors information related to codes (when relevant).
To display the information’s user must select one of the view options
(Thesaurus or S/P) and click on the icon located in from of the code ![]()
![]()
![]()
The information will be displayed in a new window, showing the following
information:
Thesaurus View
Thesaurus displays the evolution of the concerned code with its direct
and indirect successors/predecessors in all levels.
![]()
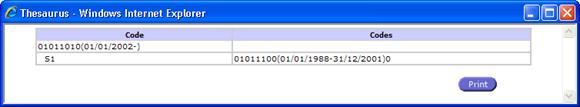
Fig. 63: Thesaurus View
Double click on a related code (a link from column Codes), will be
displayed the thesaurus for the selected code
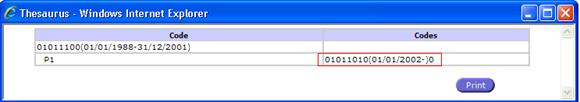
Double click again on the same code to return
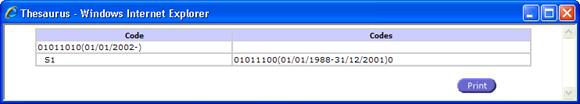
Fig. 64: Thesaurus View Navigation
Successors /
Predecessors:
Specific
Codes evolution can be seen in this screen. A code can be changed over time and
this screen will show the current code (Code column), the previous code
(Successor column) and the following code after the previous code (Predecessor
column). Along with the codes numbers the validity period is displayed.
Fig. 65: Successors / Predecessors View
The successors and predecessors are hyperlinks. Click on each of them
and the system will scroll and highlight the code at the first column.
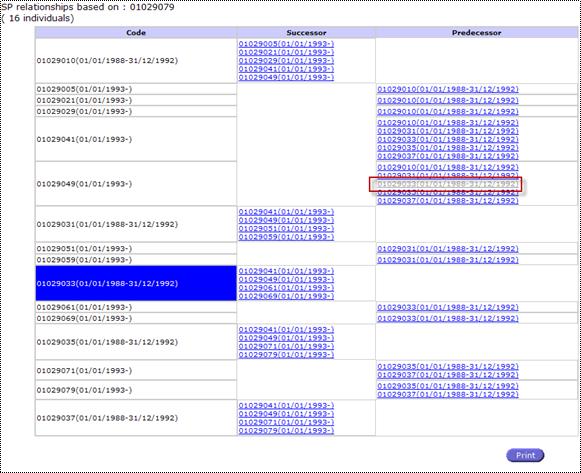
Fig. 66: Successors / Predecessors View hyperlinks
Put the
mouse over a code, the label is displayed as a tooltip:
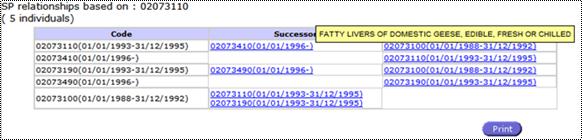
Observation:
Only the codes that have data inside the column “Label” will have a tooltip for
code.
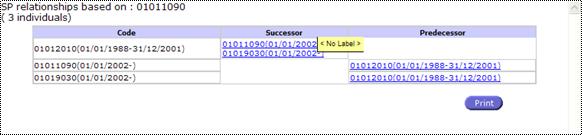
Fig. 67: Successors / Predecessors View tooltips
Filter options:
Validity period:
Two fields are available to define the list of codes according to the
validity period (Start date - End date). According to the “dates” entered in
these fields, the list of code will be reduced.
![]()
Filter by Code:
User can search a specific code by typing it in the available text box.
![]()
Label Search:
User can search a specific code by typing it in the available text box.
![]()
The search can be done either by label or by typing words and selecting
one of the options:
-
The
phrase
-
All
the words
-
Any
of the words
The Free Text option is also available from the following text box:
![]()
Navigation buttons:
User can navigate in the nomenclature via the command button located at
the bottom of the window.
![]()
User can select the first
code to display, using the ![]() text box and the Go button, navigate in the nomenclature’s pages
text box and the Go button, navigate in the nomenclature’s pages ![]() or go directly to a specific page number.
or go directly to a specific page number. ![]()